
Automated Business Reporting Services
Automated reporting builds the reports your managers read from the systems your data already lives in, and delivers them on a schedule. No exports, no copy-paste, no Monday-morning spreadsheet: the report arrives in your inbox, formatted and ready to act on.
Key takeaways
- 1Reports built directly from your mailbox, ERP, POS and HR data.
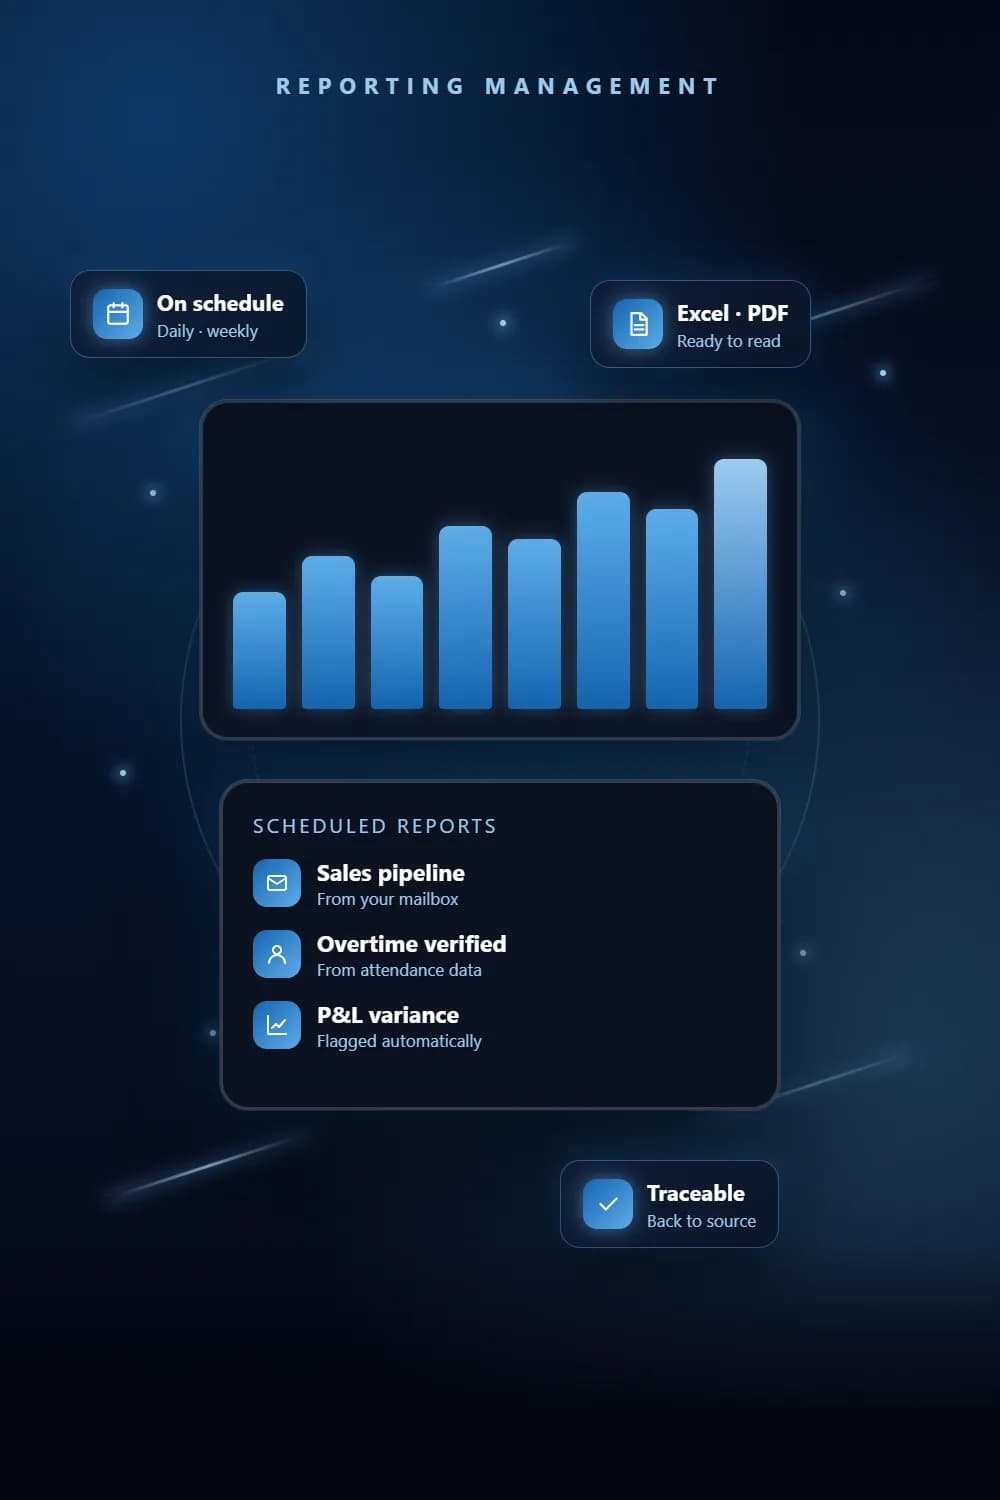
- 2Delivered on schedule as styled Excel, PDF or a live dashboard.
- 3Examples: sales pipeline from a mailbox, lead response times, verified overtime, P&L variances.
- 4Every figure traceable back to its source record.
The problem
Why businesses need Reporting Management
Reports stitched by hand
Someone exports from three systems every week and spends hours formatting the same spreadsheet.
Leads that quietly go cold
Nobody can see which enquiries were answered, quoted or ignored until a customer complains.
Numbers nobody trusts
Every manager has a slightly different version of the figures, so meetings start with arguments about the data.
What you get
What does our Reporting Management service include?
Sales pipeline reports
A Microsoft 365 mailbox read automatically and turned into a styled pipeline workbook and dashboard.
Lead response reports
Daily reports of leads received, response times, quotes sent and anything still unanswered.
HR and overtime reports
Duty-hour rules applied to attendance data to produce a verified overtime report.
Finance and audit reports
P&L comparisons, variance flags and duplicate checks delivered as CSV and PDF.
Schedules and delivery
Daily, weekly or several times a day, by email, WhatsApp or dashboard.
How it works
How we deliver Reporting Management
- 1
Pick the decisions
We start from the decisions the report supports, not from the data that happens to exist.
- 2
Connect the sources
We connect to the mailbox, ERP, POS or HR system each figure comes from.
- 3
Build & check
We build the report and check it against a period you already know the answer for.
- 4
Schedule & refine
It is delivered on schedule; we add or change measures as your questions change.
Tools & platforms
What we build with
- Microsoft Graph
- Odoo
- Python
- Excel
- PDF
- Dashboards
- WhatsApp
Industries
Who it's for
- Sales teams
- Logistics & fleet
- Restaurants & retail
- Corporate & professional services
Pricing
What affects the cost of Reporting Management?
Every project is quoted on its scope. These are the factors that move the price.
Number of data sources and how they can be accessed.
Number of reports and how often they run.
Excel or PDF only, or a live dashboard as well.
How much historical data must be loaded.
FAQ
Frequently asked questions
Yes. We read a Microsoft 365 mailbox through Microsoft Graph, classify each enquiry and turn it into a sales pipeline workbook and dashboard.
Styled Excel workbooks, PDF, CSV or a live dashboard, delivered by email, WhatsApp or link.
As often as you need: daily, weekly, or several times a day for audits and operations.
Not necessarily. Many teams only need a reliable scheduled report. If you already use a BI tool, we can feed it clean data instead.
Related
Services that work well with this
Need Reporting Management? Get a free quote.
Tell us what you need. We reply within one business day with a clear scope and quote.